Collaborative efforts in earth science data collection, storage and service have promoted the interoperability of those data. For example, the standards coordinated by the Open Geospatial Consortium (OGC) have been used by various geological surveys to publish geological map services online, and a number of schemas (e.g., GeoSciML) and vocabularies (e.g., IUGS-CGI vocabularies) have been created to mediate geological map services across the world. We now have a better environment to discover, access, decode and browse distributed geological map services or, in short, the interoperability of those data is improved.
The flow from data to information to knowledge suggests us that, besides the interoperability, we also need interactivity of those geological map services in order to better understand the meaning of the contents of those maps and then make use of them. The interactivity here means a two-way flow of data and information between geological map services and users. Exploratory visualization is proposed here to support such interactions. Our understanding of exploratory visualization is that visualization can be used as an exploration tool throughout the research life cycle rather than just as an end product of scientific analysis.
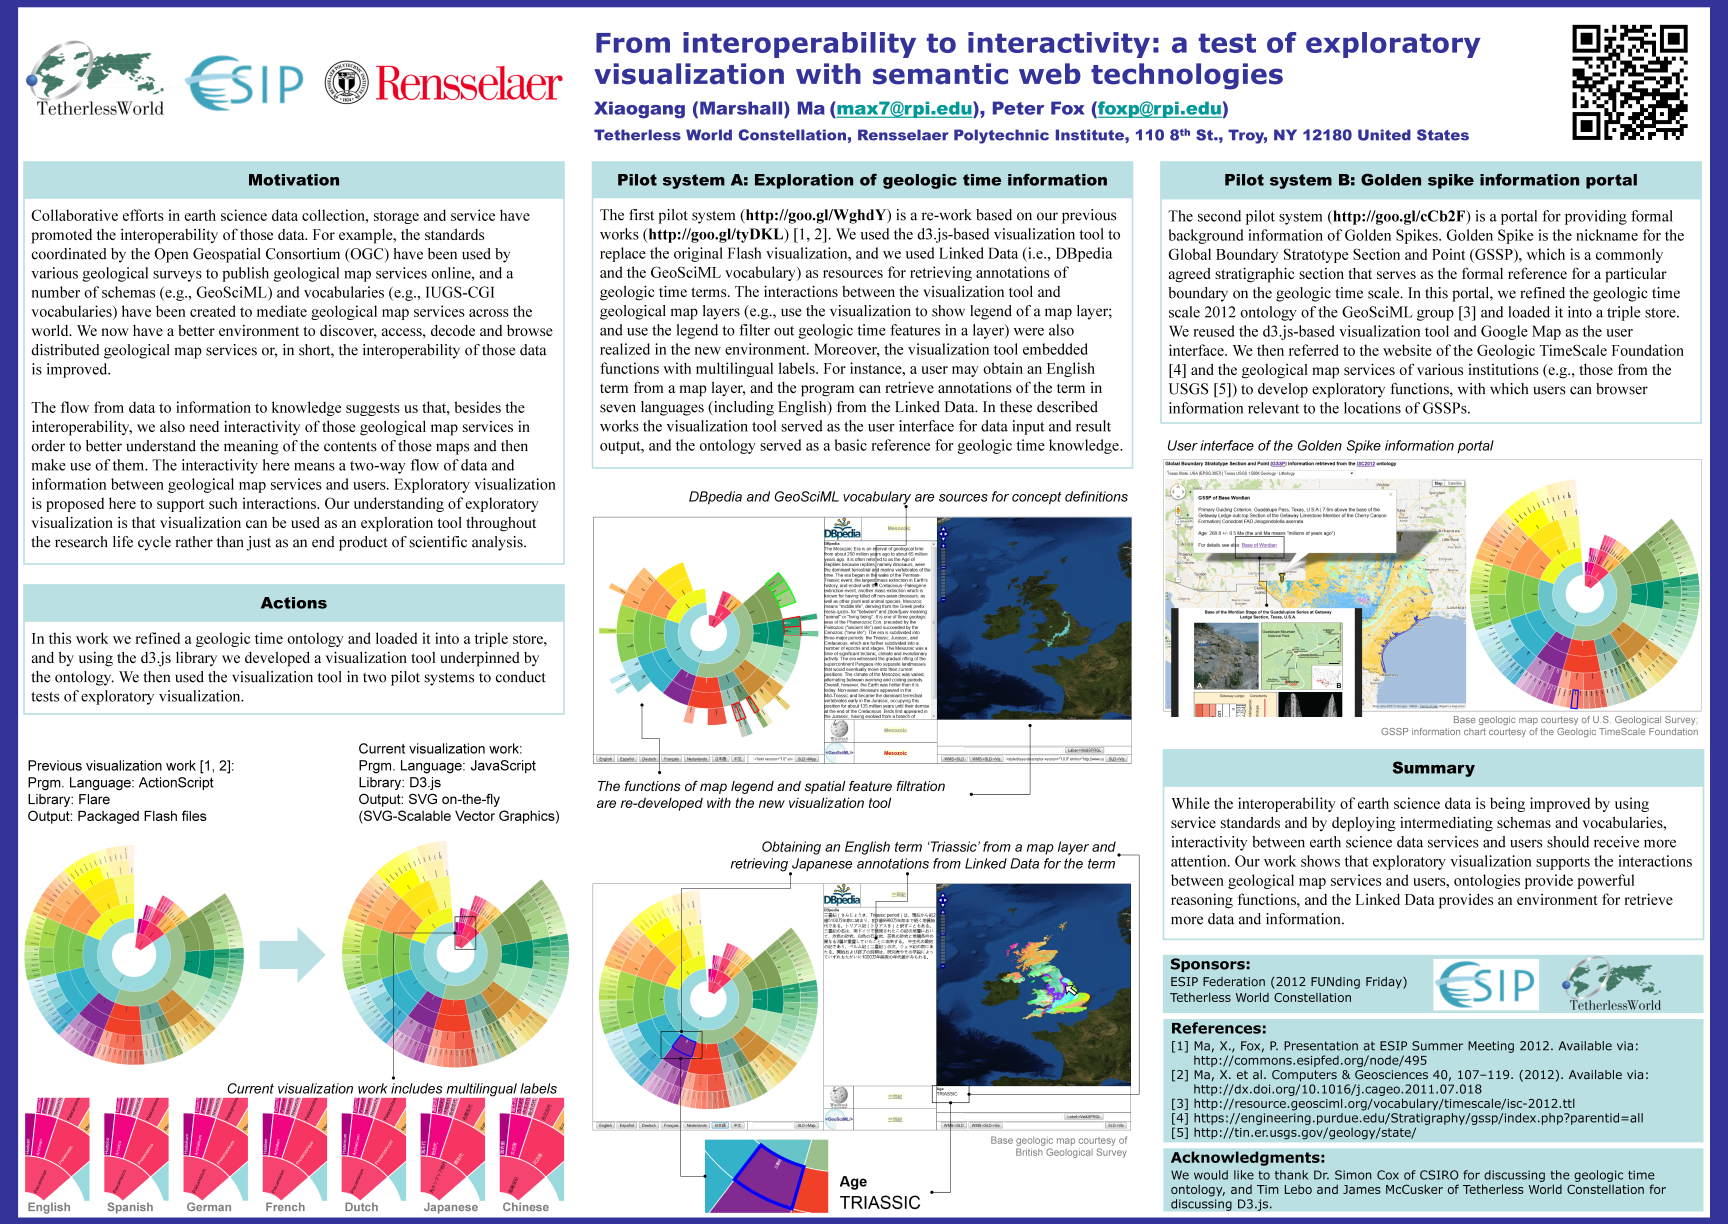
The first pilot system [1] is a re-work based on our previous works [2, 3, 4]. We used the d3.js-based visualization tool to replace the original Flash visualization, and we used Linked Data (i.e., DBpedia and the GeoSciML vocabulary) as resources for retrieving annotations of geologic time terms. The interactions between the visualization tool and geological map layers (e.g., use the visualization to show legend of a map layer; and use the legend to filter out geologic time features in a layer) were also realized in the new environment. Moreover, the visualization tool embedded functions with multilingual labels. For instance, a user may obtain an English term from a map layer, and the program can retrieve annotations of the term in seven languages (including English) from the Linked Data. In these described works the visualization tool served as the user interface for data input and result output, and the ontology served as a basic reference for geologic time knowledge.
The second pilot system [5] is a portal for providing formal background information of Golden Spikes. Golden Spike is the nickname for the Global Boundary Stratotype Section and Point (GSSP), which is a commonly agreed stratigraphic section that serves as the formal reference for a particular boundary on the geologic time scale. In this portal, we refined the geologic time scale 2012 ontology of the GeoSciML group [6] and loaded it into a triple store. We reused the d3.js-based visualization tool and Google Map as the user interface. We then referred to the website of the Geologic TimeScale Foundation [7] and the geological map services of various institutions (e.g., those from the USGS [8]) to develop exploratory functions, with which users can browser information relevant to the locations of GSSPs.
In summary, while the interoperability of earth science data is being improved by using service standards and by deploying intermediating schemas and vocabularies, interactivity between earth science data services and users should receive more attention. Our work shows that exploratory visualization supports the interactions between geological map services and users, ontologies provide powerful reasoning functions, and the Linked Data provides an environment for retrieve more data and information. In this work we focused on a single subject in earth science (i.e., geologic time) and we developed several exploration visualization functions with various data sources. We wish the exploration visualization can be tested and applied with more subjects of earth science data.
 | Name: Xiaogang Ma Organization(s): Rensselaer Polytechnic Institute Email: max7@rpi.edu |
 | Name: Peter Fox Organization(s): Rensselaer Polytechnic Institute |