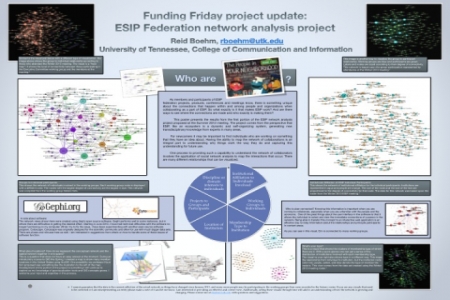
As members and participants of federation projects, products, conferences and meetings know, there is something unique about the connections that happen within and among people and organizations when collaborating as a part of ESIP. So what exactly is it that makes ESIP work? And are there ways to see where the connections are made and who exactly is making them? For newcomers it may be important to find individuals who are working on something that they have an idea about. Having the ability to map the network of collaborations is an integral part to understanding why things work the way they do and capturing this understanding for future use.
This poster presents the results from the first portion of the ESIP network analysis project proposed at the Summer 2012 meeting. The project comes from the perspective that ESIP, like an ecosystem is a dynamic and self-organizing system, generating new transdisciplinary knowledge from experts in many areas. In this first step of the project, the maps look at a recent point in time and show layers of connections including: individuals to institutions, organizational member types to institutions with key representatives. The views also look at people to group involvement, meeting participation numbers, and geographic locations of institutions. This is the first step in the project with future goals to map these same relationships overtime, and to allow for users to interact with navigating the ESIP network. One very important function of this poster is to get feedback and information from the community to make the project an accurate and effective tool for future use. I look forward to engaging in discussions and welcome your suggestions.


