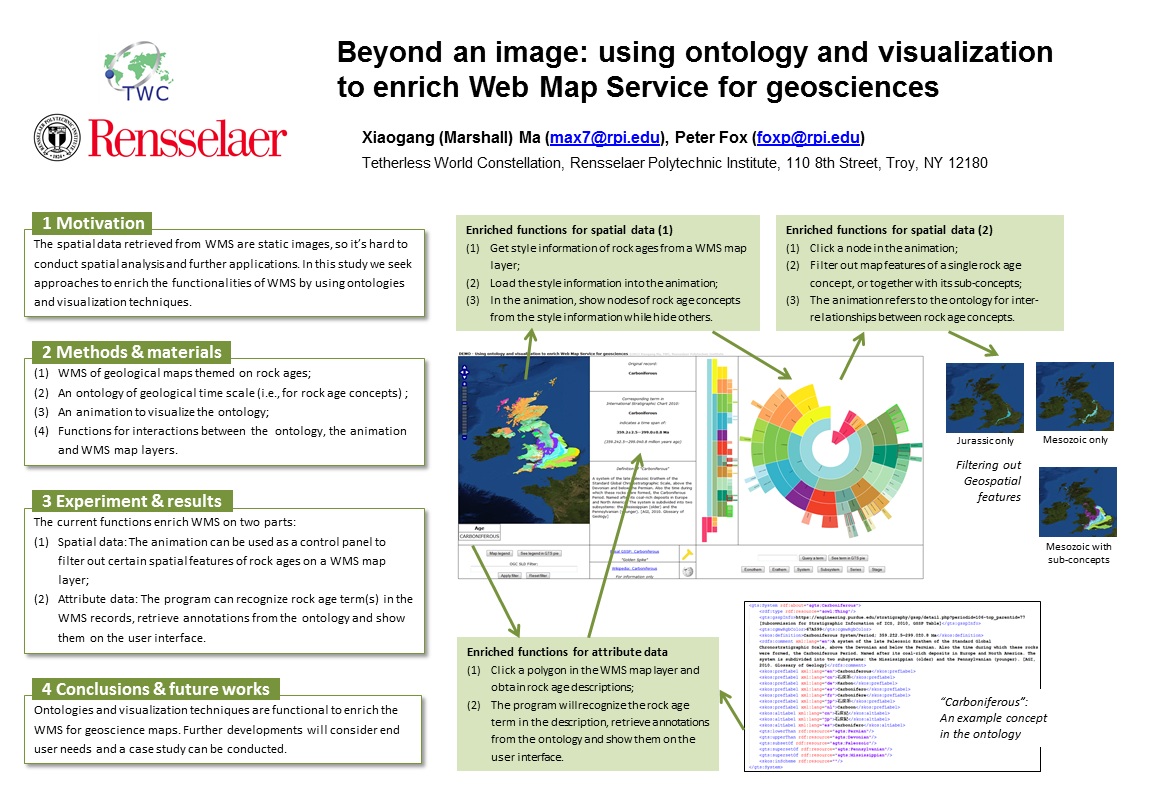
Web Map Service (WMS), a standard protocol published by the Open Geospatial Consortium (OGC), has been increasingly used in the geoscience community for publishing maps on the Internet. A data provider can upload a map (e.g., a shape file) on a data server and register WMS for it, then users can browse the map as an image and retrieve attributes of polygons on the map. WMS provides a quick way to browse maps online, however, as the spatial data returned from the server is a static image, it’s hard to conduct spatial analysis and further applications. In this study we seek approaches to enrich the functionalities of WMS by using ontologies and visualization techniques. An experiment was carried out with WMS of geological maps themed on rock ages. We developed an ontology of geological time scale and an animation to visualize the ontology. We then deployed the ontology and animation together with WMS of rock age maps and developed functions for interactions between them. Our work is still ongoing, and the current results enrich WMS on two parts. One is on spatial data. Style information of a WMS map layer can be retrieved from the server and then be loaded into the animation. The layout of the animation will be changed, making it as a legend and also a control panel for interactions with the map layer. Users can click nodes of rock age concepts in the animation to filter out corresponding spatial features (i.e., polygons) on the WMS map layer. In this procedure the animation refers to the ontology for inter-relationships between rock age concepts. Another part of enrichments is on attribute data service. The ontology includes detailed annotations for rock age terms. When users click a polygon on the WMS map layer and obtain rock age descriptions of that area, the developed functions will recognize the rock age term, retrieve annotations of the term from the ontology and show them on the user interface. This study shows that ontologies and visualization techniques are functional to enrich WMS for geoscience maps. Further developments and deployments of this work will consider end user needs and a case study can be conducted.
 | Name: Xiaogang Ma Organization(s): Rensselaer Polytechnic Institute Email: max7@rpi.edu |
 | Name: Peter Fox Organization(s): Rensselaer Polytechnic Institute |
Comments
additional videos