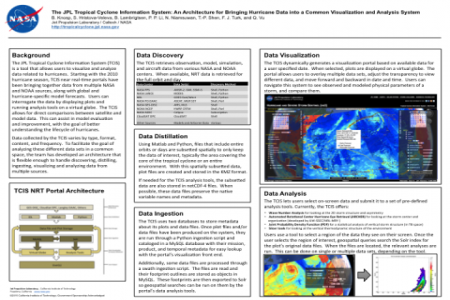
The JPL Tropical Cyclone Information System (TCIS) is a tool that allows users to visualize and analyze data related to hurricanes. Starting with the 2010 hurricane season, the TCIS near real-time portals have been bringing together data from multiple NASA and NOAA sources and allowing users to interrogate the data by displaying plots and running analysis tools on a virtual globe. The TCIS allows for direct comparisons between satellite and model data. This can facilitate model evaluation and improvement with the goal of better understanding the lifecycle of hurricanes.
Data collected by the TCIS varies by type, format, contents, and frequency. Creating an architecture that is flexible enough to handle this has been the primary challenge. The architecture supports the handling of data in four stages:
- Data Discovery: search for data at different centers
- Data Distillation: subset and plot the data to only keep the information of interest, and put it in a common format
- Data Ingestion: insert the data and metadata into a MySQL database and/or Solr index
- Data Visualization and Analysis: allow the data to be searched and displayed on a Google Earth (now Cesium) globe
Using this architecture, we are able to support a data portal that allows users to visualize maps from multiple sources on a globe. They can select to overlay images of different products and adjust the transparency to really see how different physical processes interact during the life of a storm. Additionally, users can use analysis tools that allow them to select a particular swath or region of data they see on a plot and further interrogate the data.
In this poster, we will discuss the current TCIS architecture and the technologies that support it. We will also show how this architecture supports a unique system that brings different hurricane-related data together to help give researchers a clear picture of the hurricane lifecycle.


